

The concept of guards, forwards, and centers in the game of basketball are as old as the game itself. Somewhere around the 1980s, as the game evolved with the three point shot, we started to distinguish point guards from shooting guards and small forwards from power forwards. Even to this day we try to capture a player’s role and responsibilities with modern labels such as “combo guard” and “rim runner”. While I think we have come a long way in understanding the game and its positions, I have always wondered if we can leverage the new data at our fingertips to come up with an even better way. Through this curiosity my player archetypes were born.
The Mission and Data
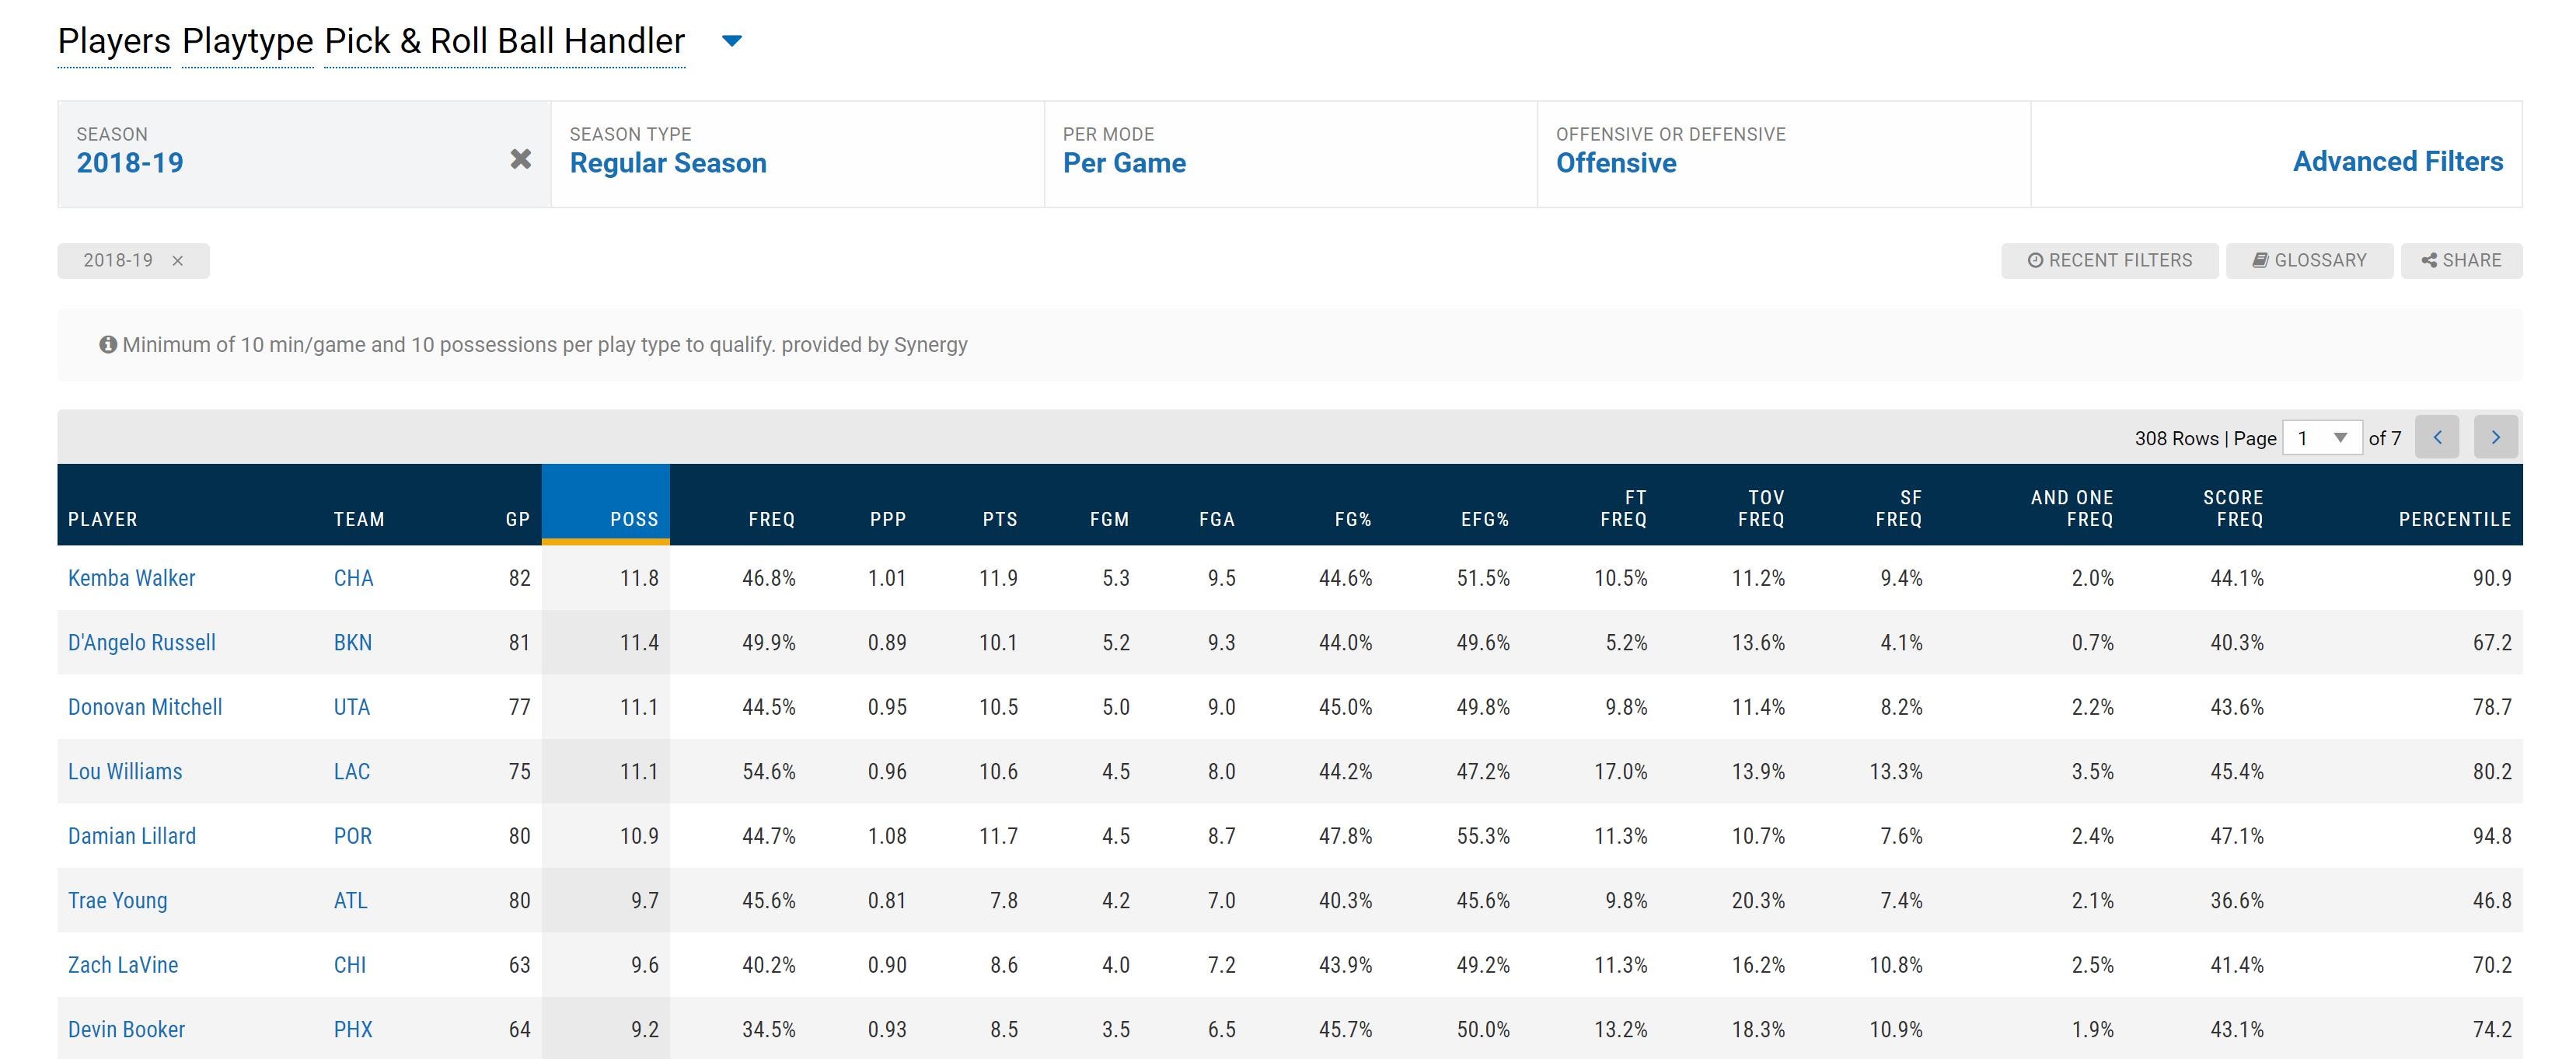
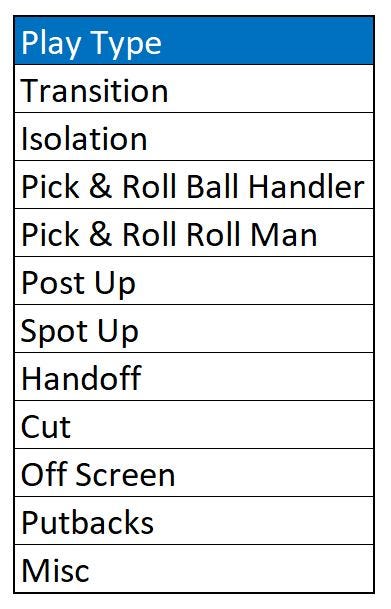
Using play type data from NBA.com I set out to find common themes in how players were used on the offensive side of the ball. Using these similarities I would group players based on how they were used within their offense. I knew that I would need to embark on a data science journey to make this happen but first I needed some data. Fortunately NBA.com has play type data going back to the 2015–2016 season for all qualified players. Below is a list of the play types available as well as the top players in Pick & Roll Ball Handling possessions per game for 2018. Data will be available at www.playingnumbers.com/data later this year.
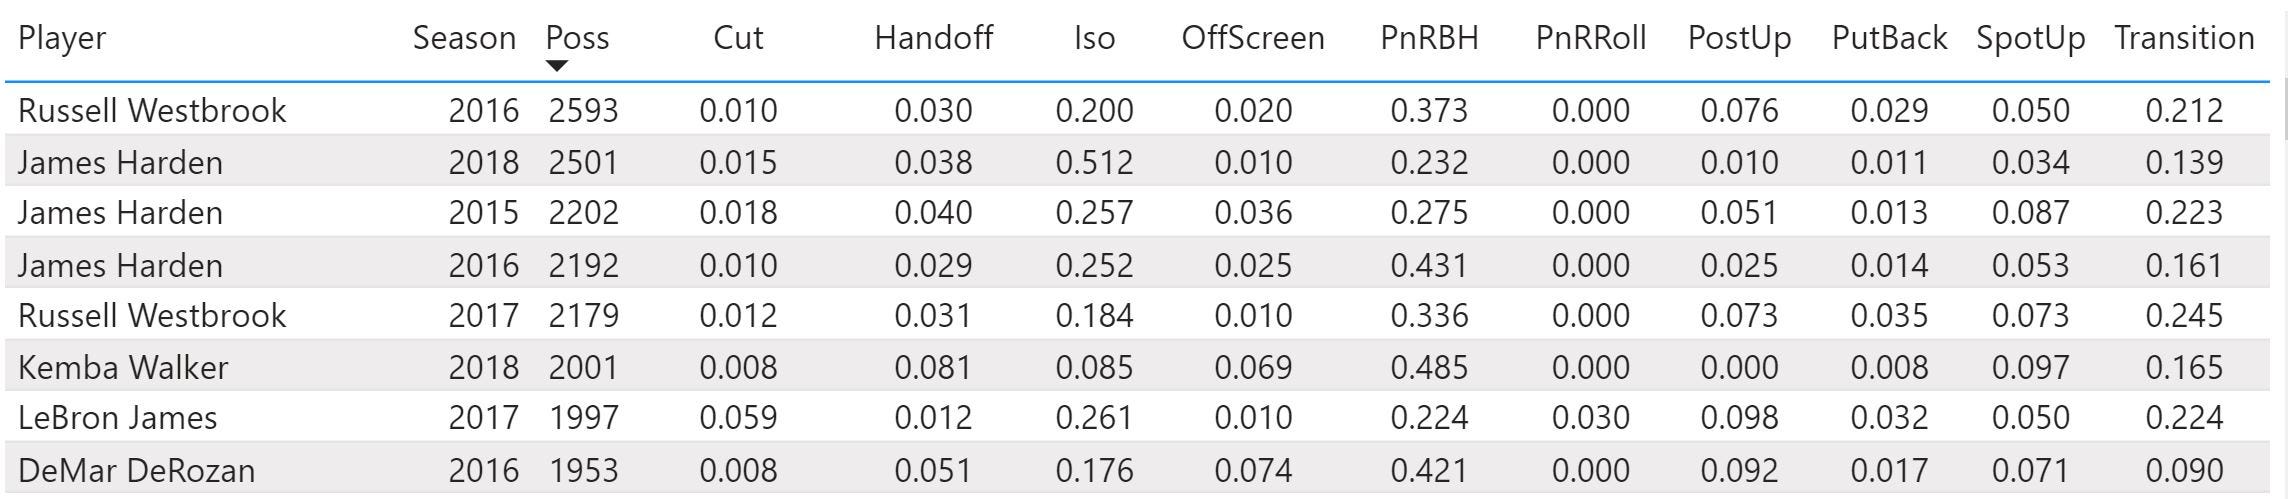
Once I had scraped, manually by hand into CSVs, all of the seasons available or each play type, excluding the current 2019 season, I loaded the data into Power BI which is my tool of choice when joining, cleaning, and visualizing data. While I had many elements to choose from I focused solely on the percentage of total possessions each player used on a given play type. This allowed me to group similar players regardless to total possessions used or efficiency. The end result, which I would use as an input for my model, looked like this:
The Methodology and Model
When I first set out to complete this project I phoned a good friend Ken Jee for some advice. I explained to him what I was trying to do and he pointed me towards K Means Clustering. K Means is a type of unsupervised machine learning model that takes unlabeled data and groups (clusters) them together based on the features you provide. I will save the fancy data science explanations for the experts so here is a nice Medium article explaining this type of model in more detail if you are interested.
I first loaded in the packages I needed to build the model for my player archetypes. Some of these I ended up not using for the model itself but the main items I needed below were sklearn KMeans and pandas.
#import packages
from sklearn.cluster import KMeans
from sklearn import metrics
from scipy.spatial.distance import cdist
import numpy as np
import matplotlib.pyplot as plt
import pandas as pd
Next I needed to load in the source data and preview the first few rows to make sure everything was in order.
# Read data from file 'df_PlayType.csv'
# (in the same directory that your python process is based)
# Control delimiters, rows, column names with read_csv (see later)
data = pd.read_csv("df_PlayType.csv")

#Drop first column
df = data.drop('PlayerSeasonId',1)

#preview the first 5 lines of the loaded data
df.head()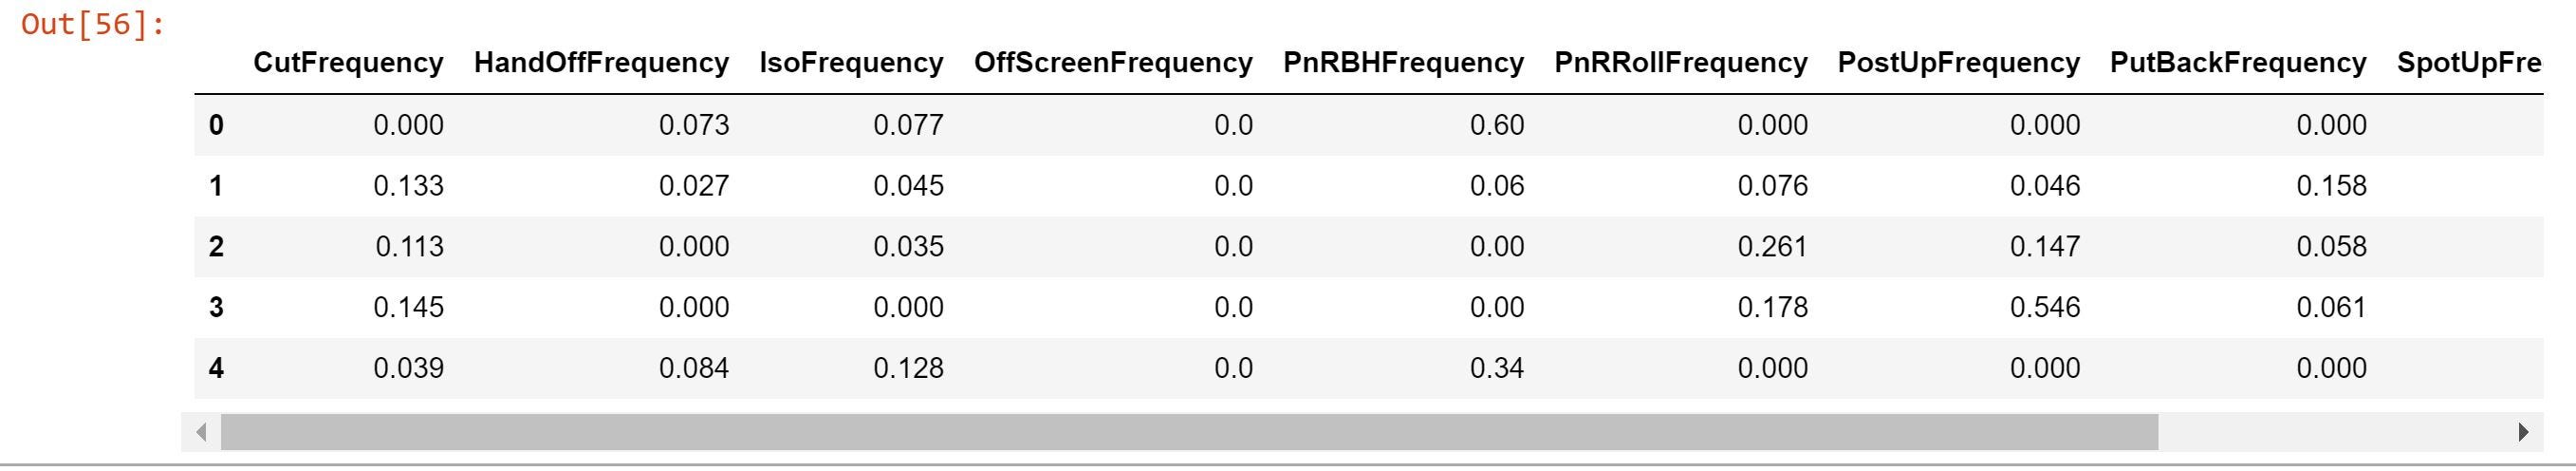
With my data locked and loaded I now could start to build my KMeans model. The first step, and possibly most important, is deciding how many groups or clusters to model. The most effective way to do this is using the elbow method. A detailed explanation of this can be found here but essentially we are testing out the data with several numbers of clusters to see where we start getting diminishing returns. In the chart this point will look like an “elbow”. Below you can see the code and result for my data.
#Building the clustering model and calculating the values of the Distortion and Inertia

distortions = []
inertias = []
mapping1 = {}
mapping2 = {}
K = range(1,10)

for k in K:
    #Building and fitting the model
    kmeanModel = KMeans(n_clusters=k).fit(df)
    kmeanModel.fit(df)

    distortions.append(sum(np.min(cdist(df, kmeanModel.cluster_centers_,'euclidean'),axis=1)) / df.shape[0])
    inertias.append(kmeanModel.inertia_)

    mapping1[k] = sum(np.min(cdist(df, kmeanModel.cluster_centers_,'euclidean'),axis=1)) / df.shape[0]

    mapping2[k] = kmeanModel.inertia_

    plt.plot(K, distortions, 'bx-')
plt.xlabel('Values of K')
plt.ylabel('Distortion')
plt.title('The Elbow Method using Distortion')
plt.show()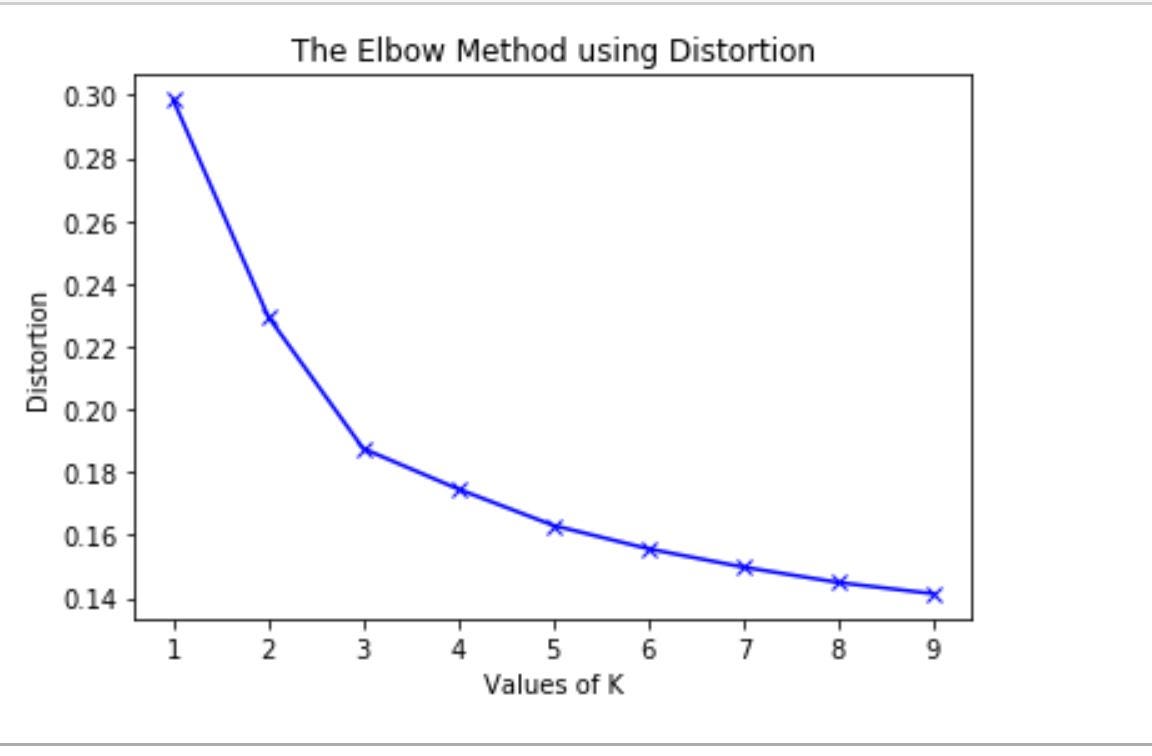
Many people would look at the graph above and declare the elbow value as 3. They would not necessarily be wrong however knowing basketball as well as I do, I knew that there are many more types of offensive players than three. There seems to be another slight decrease in value at 6 and so this is the number of clusters I went with. After seeing the data I know that by going from three to six the model broke down three overarching groups into two slightly more nuanced groups each. All that was left to do now was fit the model and add the new cluster values to my existing data.
#fit and predict kmeans model

kmeans3 = KMeans(n_clusters=6, init='random',n_init=10, max_iter=300,tol=1e-04, random_state=0)
pred_y3 = kmeans3.fit_predict(df)

df3 = pd.DataFrame(pred_y3)


# append predicted y to CSV

data['Archetype'] = df3

data.head()

data.to_csv('csv_result.csv')
The Results
When I started to look into the data I was giddy with excitement. The players grouped together made sense in my head based on my understanding of the game. While the labels themselves were just a number from 0 to 5, I knew exactly what each of these meant in the grand scheme of things. Below is a table showing the five archetypes created in my model and the average frequency of each play type for the players in that group.
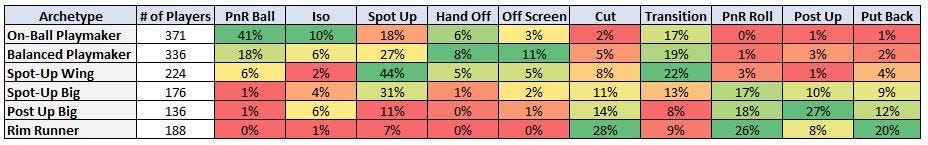
I am not 100% married to these labels, and may tweak them as we go, but you can see some clear lines drawn in the sand. On-Ball Playmakers are defined by an increased number of possessions in isolation and as a pick & roll ball handler. Balanced Playmakers on the other hand mix in off-screen and hand-off actions to keep defenses on their toes. Spot up specialists are defined by a high number of possessions used by spotting up behind the arc while their teammates create. I use the terms Wing and Big loosely for these players because the only difference is Wings also create frequently in transition while Bigs operate frequently as the roll-man in the pick & roll. Post Up Bigs on average post up more than all other archetypes combined and spend a good amount of time in the pick & roll. Finally, Rim Runners very much rely on picking up the scraps on offense mostly generating buckets through setting screens and rolling to the basket, cutting to the basket when their man helps at the rim, and cleaning up teammates misses via the put back.
With my new set of archetypes in hand I can take a closer look at how each player is used within their offense and how each group of players creates value for their teams. Beyond the Arch is going to be a series of articles where I try to leverage these new offensive archetypes into a better understanding of the game of basketball. Through this process I will try to answer questions like :
- Which archetype is most valuable?
- What players excel within each archetype?
- Can players roles change over their career? How about from game to game?
- Are certain lineup combinations more effective?
- Can we use archetypes to predict how well a free-agent would fit into a new system?
The number of questions I have is infinite but now at least we have a really cool way to explore them. I hope you enjoyed this and I would love any questions or comments you might have.
Hey man this is great content!
This really reminded me of nba 2k where each player now has an “archetype”.
Each representative player you identified fits perfectly. I was surprised how well the term “balanced playmaker” fits Stephen Curry’s playstyle