

Using K-Means Clustering to analyze the types of teams Real Madrid and Barcelona drop points against in La Liga.
This is a shorter version of a longer paper, a link to the full paper is here. A link to the code and the datasets used is here. To see the final results of this paper, skip to the Conclusion.
Overview
Real Madrid’s success in the Champions League during the last decade is in stark contrast to their poor performance in La Liga. By using K-Means Clustering to categorize the teams the Real Madrid and their arch-rivals Barcelona have lost and drawn to in La Liga, we can get a clearer idea of where Madrid is making mistakes in this competition.
History of Real Madrid
Throughout the late 1990s and the 21st century, Real Madrid has been known as the club in world football to spend an exorbitant amount on the players they desire the most, specifically attackers. Galaticos, as they became known globally, would often go on to be the offensive leaders of the team and the person that Madrid’s attack would flow through. While there have certainly been legendary Galaticos in the past, perhaps none have been more impactful to the club in modern history than Cristiano Ronaldo. Signed in the summer of 2009 as part of the answer to arch-rival Barcelona’s dominance of Spain and Europe (They were the first team to win six trophies in one year), Ronaldo would stay at Madrid for almost a decade. The defining moments of the Ronaldo Era at Madrid would almost all come in the Champions League, as Madrid went to the semifinals of the competition 8 years in a row and was able to win the entire thing 4 times in the span of 5 years; to say that this is anything other than legendary is an understatement.
Despite Madrid’s success in the Champions League, their struggles in domestic competition cannot be overlooked. In Ronaldo’s time at Madrid (nine seasons), Real Madrid was only able to win La Liga two times. In the same time period, Barcelona won the league title 6 times and city rivals Atletico de Madrid won the title once. While the Ronaldo Era won’t be looked back on as unsuccessful, the question remains: How can a team that was so dominant in one competition be so lackluster in another?
I attempt to answer this question by using Machine Learning. I’ve created a dataset for Madrid and Barcelona that lists every single time they’ve lost or drawn against an opponent in La Liga from the 2009-10 all the way until the 2017-18 season, which covers every season that Ronaldo was at Madrid. On each dataset, I’m going to use a Machine Learning technique called K-Means Clustering (K-Means or KMC for short) to find the average teams that Madrid and Barcelona are losing points to and see if there are any clear differences. K-Means Clustering will be done in a couple of different scenarios to get a better understanding of where exactly Madrid is struggling and Barceona has been succeeding (For example, dividing the dataset up by manager and doing KMC for each manager)
Data
For each of the 2 teams, the dataset is made up of the following features:
- Time of the season, which is represented by the matchday feature.
- The amount of rest that each team has had since their last game, represented by the days_since_last_game features.
- Whether the game was home or away, represented by the home_0_away_1 column.
- The strength of the opposition in the form of where they placed in the league that year (final_league_position), as well as the form of the opposition going into the match (elo_opp). While most sites list form as an important factor in determining which team is going to win, there hasn’t been much research into quantitatively determining the form of a team outside of looking at the last 5 or so results. The website clubelo.com is the only source I was able to find that does this. It allows users to look at a team’s form (called elo, which is a number of points your team has as a result of their results across decades), which gives us the information we need about the form of our opposition.
- The form of Madrid and/or Barca, depending on which team we’re looking at (elo_madrid or elo_barca).
- The difference in elo between the two teams (diff_elo).
- And finally the betting odds of a Madrid/Barca win (odds_of_madrid_win or odds_of_barca_win).
- The amount of points earned by the team in the game – this will be either a 0 for a loss (no points collected) or 1 for a draw (1 point collected).
Data collected after the 2014/15 season contains an extra feature called xg_diff, which calculates the difference in xG by simply doing (the xG of Madrid/Barca in the specific match) minus (the xG of their opposition).
This dataset also only considers games where the league title hasn’t been won yet. The reasoning behind this is that it’s hard to gauge the team’s motivation since there’s nothing left to play for; Madrid and Barca tend to let their starters rest and be ready for The Champions League and Copa Del Rey when they can’t win the league, so this opens up the door for lineups with bench players, new formations, and a general lack of motivation to win.
K-Means Clustering
K-Means Clustering (KMC) is an unsupervised Machine Learning method that computes the average at multiple locations in numerical data.The k in KMC is the number of averages, or clusters, that are being computed; k is a number that’s greater than 1 but less than the number of rows in your dataset. The basic steps of KMC are as follows:
- Pick k random points in your data to start the algorithm (For us, pick k rows of data). These points will serve as our initial clusters C1, C2, C3, …., CK.
- For each point Di in the data D, calculate the euclidean distance between d and each cluster C. The C with the lowest euclidean distance is the cluster that d gets grouped into. For two dimensional data for example, we would be doing the calculation
 , where (x1,y1) are the coordinates of one cluster and (x2,y2) are the coordinates of Di.
 - After each Di has been grouped to a cluster, calculate the average of each cluster. If a cluster C1 has 2 points of two dimensional data grouped to it, for example, then the coordinates for the new C1 would be ((x1 + x2)/2, (y1 + y2)/2)
- Repeat steps 2 and 3 until the Di in each C remains the same.
The benefits of using KMC as opposed to a normal average calculation is clear. For example, pretend that we’re using KMC on the matchday feature in our data for one season, and for this season Madrid lost/drew against teams on matchdays 1,2,3,4,35,36,37 and 38. If we were to calculate the average normally we’d get 19.5, which would lead us to believe that this season Madrid lost a majority of its games near the halfway point, but we can obviously see is wrong. Using KMC with k = 2 would give us a much better representation of the data and tell us that on average, Madrid lost to teams in the beginning of the season (1 Cluster would contain the points 1,2,3,4) and the end of the season (The second cluster would contain the points 35,36,37,38).
For more information on KMC, take a look at this video from StatQuest with Josh Starmer.
One of the most important parts of KMC is deciding on how big or small k should be. KMC is clearly a very powerful algorithm, but when used with the wrong value for k then it becomes difficult to extract meaningful information from your data.
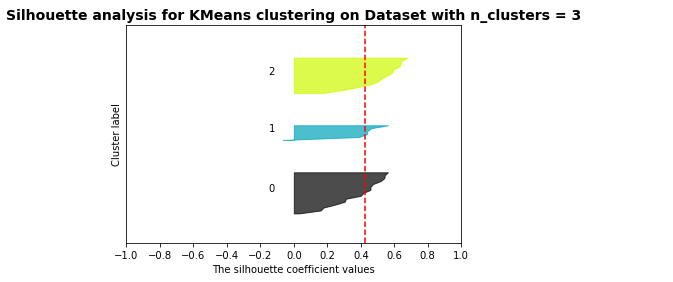
Fortunately, there are many methods that have been developed to help determine the best k. For this analysis I’ll be using Silhouette Analysis, which involves measuring 1) the distance between each point in a given cluster (you want this value to be small since it measures how similar the data points in this cluster are to one another) and 2) the distance between each cluster (you want this value to be large since it measures how dissimilar this cluster is the others).
More information on how these two values are calculated can be found here and I adapted the code from this tutorial to find the optimal k for my data.
The plan for the data is as follows:
- Input each data file that we’re examining, and run the silhouette analysis code on it for k = 2-10 to find the ideal k to use in KMC
- Run KMC to obtain the center of each cluster, and analyze these centers to learn more about what types of teams Madrid and Barcelona are losing to on average.
This is the data we’re looking at for each team:
- Losses and Draws from the 2009/10 season to the 2013/14 season (non-xG data)
- Losses and Draws from the 2014/15 season to the 2017/18 season (so that we can look at xG data as well)
- Pt1 and 2 data combined (the xg_diff column from 2) will be removed)
- Data organized by manager. For this category, the manager needs to have at least 2 seasons of coaching either Real or Barca in this 9 season time period in order to make sure there’s enough data points to get meaningful information. For Real such coaches are Mourinho, Ancelotti and Zidane; for Barca it’s Guardiola and Enrique
- Title Winning Seasons for each team
- Title Losing Seasons for each team
To see my full breakdown of each category of data, check out the link here.
Findings
Real Madrid’s results in the Champions League in the Ronaldo Era certainly won’t be looked back on as a failure, but some questions will be asked about their sub-par league performance. Throughout the different managers that have tried to change Madrid’s luck in the league, this analysis shows us that Madrid typically fell into the same patterns over and over again which cost them the league title on more than one occasion. The biggest patterns included 1) dropping points to their direct competitors both home and away, 2) being unable to pull out results in away games against mid table teams and lower, 3) creating enough offensive opportunities for themselves but not capitalizing on them (evidenced by their xg_diff being 1 in the first cluster of the 2014/15-2017/18 dataset), and 4) not being able to start their league campaigns with good form. Solving any one of these problems will be beneficial for Madrid in the long run, as the smallest or margins tend to make a difference in the title race. Being able to secure even 3 or 4 more points a season can quite literally be the difference between 1st or 2nd, so in the future Real will be doing themselves a favor to fix one of these 4 areas.
In addition to the data that I already collected, it would definitely have been beneficial to have access to more reliable data about injuries and the form of certain players, as this could’ve given us more information about why and how Madrid was losing certain games. I treated a majority of this analysis with the assumption that Madrid was playing a full-strength lineup, when in reality this wasn’t always the case; knowing which games were played at full strength and which weren’t would’ve definitely helped this analysis. In addition, having more information about how these games unfolded would’ve helped. Having more information about the lineup strength of the other team, how many passes they attempted in each third of the field, how much possession they had, how many key passes they made, etc. would give us a better idea of the different styles of teams that have taken points from Madrid the most. Future work would definitely add this data, but only for the most recent seasons as this type of data is fairly new and wasn’t available even 10 years ago.
This is an excellent feature and I thoroughly enjoyed reading it. Well done!