

Last year, Cameron Champ lead the PGA Tour in driving distance with a monstrous average drive of 318 yards (55% of Fairways). Chez Reavie lead the Tour in driving accuracy by hitting an absurd 76% of fairways (avg. 287 Yards). While I would absolutely replace my driving ability with either of their’s, I couldn’t help but wondering: Which players driving would have a stronger positive impact on scoring?
We can answer this question by directly using strokes gained off the tee (SG OTT); however, many people believe that this metric over-values distance. To avoid this confusion, we will take an alternative approach using SG OTT components.
Case Study (Cameron Champ, Chez Reavie, and Keegan Bradley)
To understand who we would rather have hitting our tee shots, let’s do an example. We will evaluate Cameron (Long), Chez (Straight), and Keegan (Good Mix of Both).
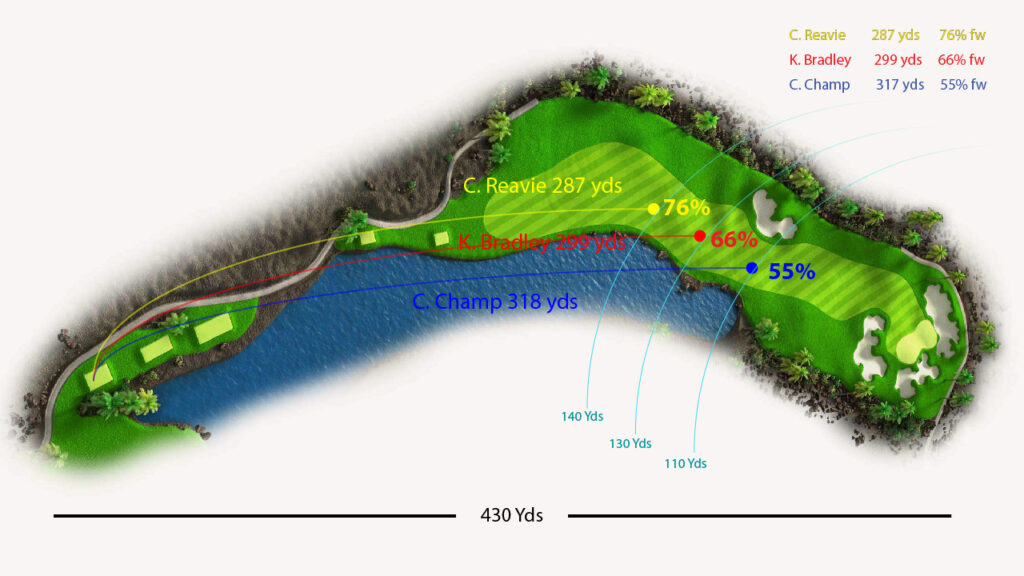
Our first example is a 430 yard par 4. This is about the average distance of par 4’s on the PGA Tour. From figure 1, we can see that on average, Cameron will have ~110 yards in, Keegan will have ~130 yards in, and Chez will have ~140 Yards in. Based on these numbers, we want to understand what the average PGA Tour player would make from each of these driving distances. This is the fairest way of determining who’s drive saves the most shots.
At this point, we know how often these players hit the fairway; however, when the ball does not go into the fairway, it doesn’t just go into the rough. It can land in fairway bunkers, water, out of bounds, bushes, etc. We have to account for scoring from different lies as well as distance.
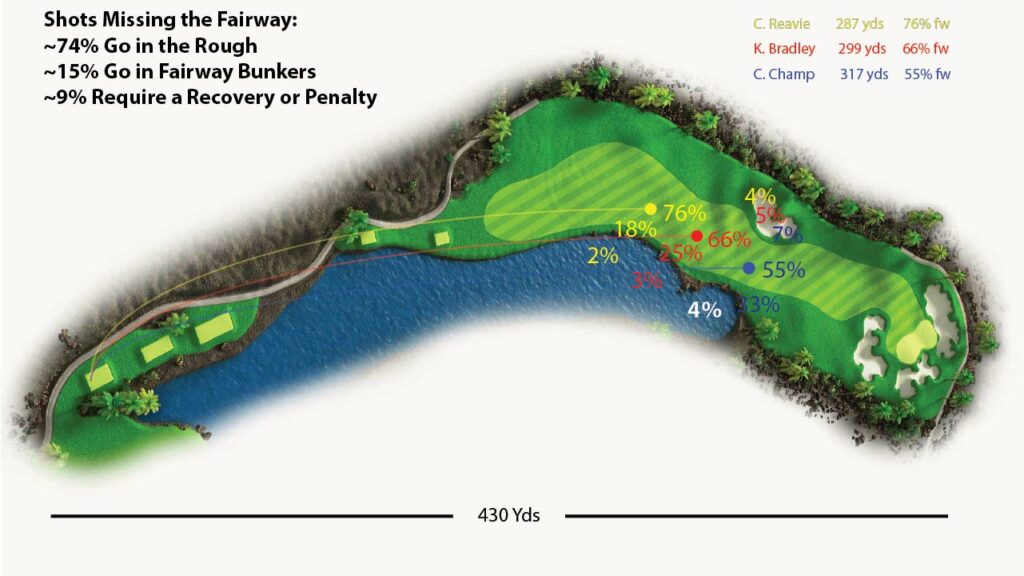
Figure 2 shows the probability that each player will hit it in the various locations outside of the fairway. Looking at the data, we know that Chez misses the fairway 24% of the time, Bradley misses the fairway 34 % of the time, and Cameron misses the fairway ~45% of the time. Of shots that do not hit the fairway, we see that ~74% of them end up in the rough, 15% of them go in fairway bunkers, and 9% of them require a penalty, re-teeing or a punch-out. These don’t add exactly to 100% because we are excluding shots that end up on the cart path or untraceable areas. For each player, we get the % of the time they are expected to hit it into these various lies by multiplying the % of the time they miss the fairway with the probability it goes into one of the three different non-conditions.
Knowing the expected landing locations of these shots, we next need to look at what the players will score from each of the locations, from the fairway, the rough, the bunker, and from a punch out. We get the expected score from each distance and location from the strokes gained baseline (table 1).
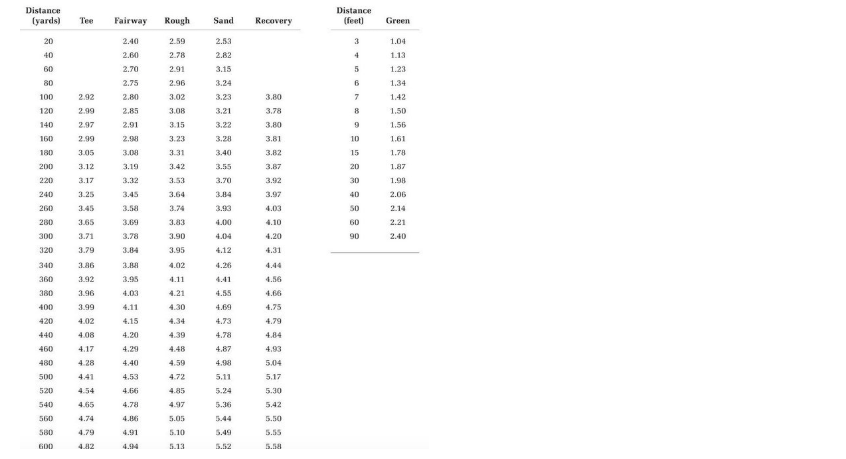
This table shows how many shots it takes on average it takes to get in the hole from a distance and location. For example, from 110 yards in the fairway, we expect the average golfer to get the ball in the hole in 2.83 strokes. That means on average they would make 3.83 on the hole from that location.
To get the expected hole score, we take the probability that they hit it in each of these locations times the expected score for the location. We can see the expected score by location as well as the math to calculate average golfer expected scores in figure 3.
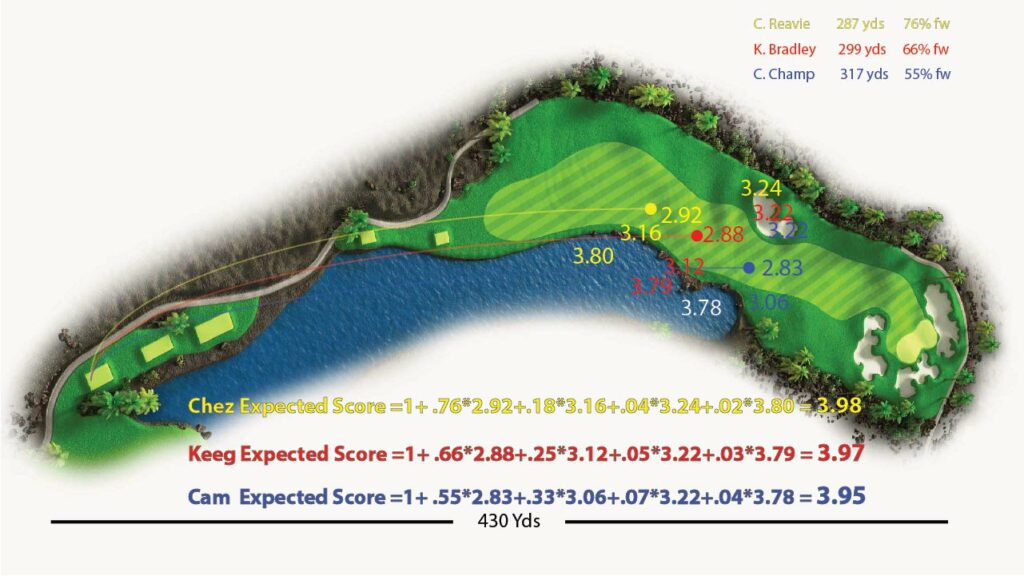
To get these expected score of the hole for the average golfer, we take the probability of hitting the fairway and other non-fairway locations (figure 2) and multiply them by the expected score from those locations (figure 3). We also add 1 to account for the drive that has already been hit.
On this example hole, Cameron champ has a very small edge. As it so happens, golf is not made up entirely of 430 yard par 4’s. Let’s see how this advantage changes as the hole distance changes.
Taking Different Holes into Account
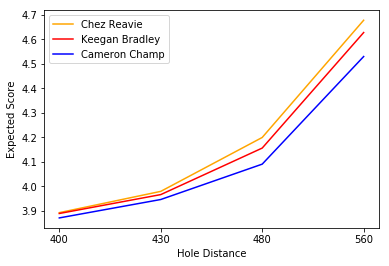
Figure 4 illustrates how expected scoring changes by hole distance. As you can see in the visual, the advantage that Cameron Champ has grows as the hole length gets longer. Again, all of the approach shots are assumed to be taken by the average tour pro.
It looks like the scoring increase associated with taking longer approach shots is greater than the one associated with hitting it from the rough as you get further from the hole.
Not So Fast!
It seems like there is pretty conclusive evidence from the case study and the hole distance chart; however, that is not the whole story. There are a few factors that may confound these findings.
One thing that this analysis does not cover is the difference between golf courses. Some courses can have significantly harder rough or more opportunities to hit the ball out of play. Figure 5 shows what happens to scoring between our three players as we incrementally increase the rough difficulty.
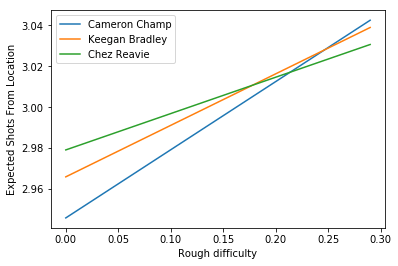
As you can see in the graph, as the rough difficulty increases we reach a point where we prefer Chez’s driving over both Keegan and Cameron. This suggests that in tough rough conditions (like the US Open), we may prefer the straighter driver.
The general trend on the PGA Tour is to increase the length of the courses. If they were to instead make the rough more difficult, they could potentially help level the playing field between bombers and straight hitters.
Another scenario where it may not be best to always bomb it is related to individual player differences. In our analysis, we use the “average PGA Tour player”. In truth, there is tremendous variation between individual golfers. In rare cases, golfers actually hit it closer to the hole from a slightly further yardage. An example of this would be if a player hit it closer from 120 than from 110. This happens occasionally because players may be in-between clubs or because they practice more from a certain range. If most of your drives put you at a distance where you don’t optimize proximity, you may improve slightly improve your chances by laying back.
Final Thoughts
Based on these findings, in most scenarios, we would prefer to have the long and crooked drive over the shorter but straighter one. With that being said, there are clearly some glaring exceptions to this rule. If we are playing a course with more trouble off the tee or with longer rough, we may consider dialing it back and keeping it in the short grass.
Before you buy a new driver and start swinging out of your shoes on every shot, remember that this insight is derived from professional golfers. There is little to no correlation between how this would impact the amateur game. Given the data, perhaps that is an analysis for another time.