

I recently read Sprawlball By Kirk Goldsberry. In the book he talks about the impact that the 3-point line has had on the incentive structure of basketball. Players make more points per shot from 3-point range and at the rim than anywhere in-between. This discourages mid-range jumpers which used to be a centerpiece of the game. As teams wise up to this, players take less and less of these “lower value” shots. Over time, this trend has had major implications on the game and team compositions.
The code for this project can be found here: https://github.com/PlayingNumbers/Nba_3pt
The current 3-point line stands 23.75′ away from the rim along the arc, and 22′ from the rim on the corners. I wanted to use some math to determine if there was an optimal distance for the 3-point line that would keep the shot relevant, but not necessarily overshadow the other types of plays.
Data from 2014-2015 Season
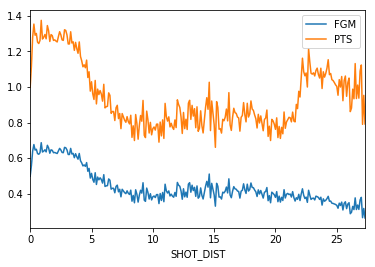
Take a look at Figure 1. The blue line represents the make probability and the orange one represents points per shot. After about 5′ there is a relatively small drop-off in make % as you get further from the rim. The difference in the make % of a 3-point shot and one just inside of the line is very small, but one of these shots is worth 50% more points. This is illustrated in the graph by the huge spike in points per shot (orange line) at around 23′, where the 3-point line starts. From the U shape of the points per shot line, you can infer a large incentive to shoot close to the rim and from beyond the 3-point line.
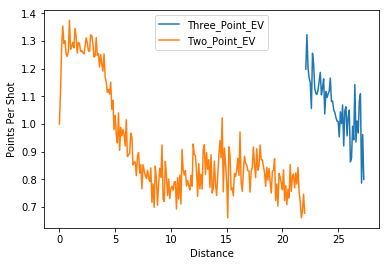
In Figure 2 I have separated the 2-point shots from the 3-point shots. This clearly shows a greater discrepancy between the relative value of the shots as you get further from the rim. One thing to notice here is how valuable corner threes are. The closest threes to the rim have the highest points per shot.
Based on shot volume, the average points per shot of a 2-point shot net out to be .977 while the average 3-point shot is 1.055. I believe that a fair three point line is at a distance where the expected points per shot of a 2-point shot and a 3-point shot equal to one another.
Rather than projecting this out, we have enough data that I can use the real shots for the season. To perform this analysis, I wrote a function that changes the value of 3-point shots to 2-points if they are inside of a certain threshold. I then compare the average points per shot for the new distribution of 3-pointers and 2-pointers. Figure 3 shows the 2-point and 3-point points per shot convergence.
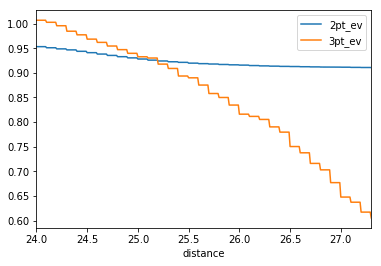
Based on this graph, we can see that the intersection point is at 25.2′ from the rim. This is where I believe the optimal 3-point line would be. In theory, this could make 3-point shots hard enough so that other types of shots would become more common.
Based on this analysis, I wanted to do a case study of Steph Curry, the greatest 3-point shooter of all time. I wanted to see how this change would impact his value to a team. Would this change negatively impact his presence as a player?
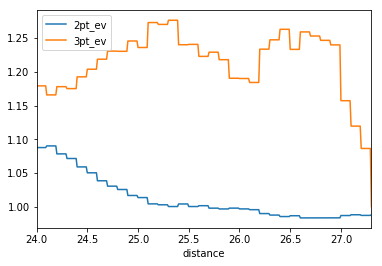
Figure 4 shows Steph Curry’s points per shot for 2-point and 3-point shots as the line is moved back. As you can see, it appears that he has almost limitless range. The lines simply do not converge. This is extremely atypical, and suggests that Steph has a special ability to shoot the 3, even from long range. With this change, he could become even more valuable to his team. This observation should be taken with a grain of salt because Steph has a relatively small sample size outside of 25′.
Before signing off, it is important to mention a few limitations of the research. First, the data is from the 2014-2015 season, so it may not be representative of the game today. Second, there is no way to know how players would respond to a longer 3-point line. Perhaps they would start practicing at longer range, and actually increase their make % outside of 25′. Finally, if the 3-point line were pushed back, the quantity of shots taken outside of it would increase dramatically. Points per shot is a function of the quantity of shots at a certain range multiplied by the make % and the point value. Adjusting for the new distribution is not something that I have accounted for here.
This analysis is far from perfect, but I believe it is a great starting place to start re-thinking the rules. Historically, rules have been made based on assumptions, not based on hard data. We can improve the quality of the game if we start to think quantitatively about how rule changes impact play.