

Analytics is taking over the game of basketball in a beautifully informative way. Every metric sheds new light on a teams performance and provides a different way to rank and compare them. This new data can be used to discover valuable insights that can help front offices game-plan or help a sports bettor gain an edge. One measurement I’ve found useful for judging a team’s performance is pace. According to basketball-reference.com the pace factor estimates the number of possessions a team has in 48 minutes. I was intrigued by the recent rise in pace throughout the league and wanted to see what underlying factors lead to this change. I came across “Why NBA Game Pace is Historically High” by Kelly Scaletta, which looks into the reasons pace has risen across the league in recent years. It made me wonder how pace of play changed based on a team’s opponent; do faster teams force their opponents to keep up with them or do slower teams force their opponents to play a similar style?
The code for the scraper used to collect data and the notebook used for analysis can be found here.
Before I could begin to answer this question I needed to gather the data first. I built a web scraper to collect the season average for each team as well as the pace for each game they played. The data was gathered from basketball-reference.com for the 2018–2019 season. Using the mean and the standard deviation for average pace I divided the teams into four groups, which is illustrated in the graph below.
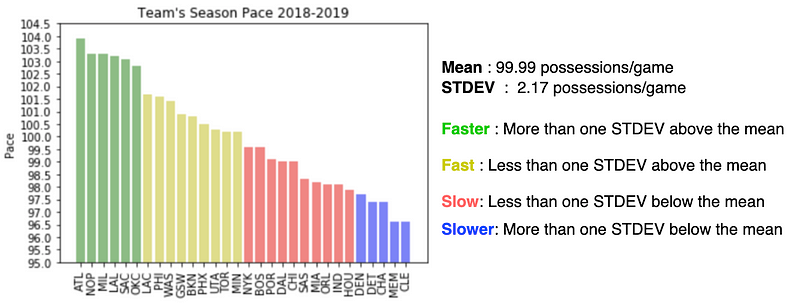
The team with the highest pace in the 2018–2019 season is the Atlanta Hawks with 103.9 possessions/game and the Cleveland Cavaliers and Memphis Grizzlies tie with the lowest of 96.6 possessions/game. It’s interesting to note the drop off between faster and fast teams compared to the more gradual transition between slow and slower teams. This leads me to think that faster teams will have the strongest impact across all their opponents, forcing their opponents to play fast in order to keep the game close.
In order to determine the affect a team’s opponent had on their own pace I created two metrics I call Game Pace Difference (GPD) and Team Pace Difference (TPD) for each game played in the regular season. These metrics are calculated as follows:

GPD can be used to determine if a team played above or below their season average and TPD can be used to determine if they played an opponent that was faster or slower than themselves. Using these metrics together, games can be identified based on average pace and game pace and the relationship between the two groups can be quantified. By plotting these metrics against each other, games can be categorized and the affect of an opponent’s pace can be visualized to gain a better understanding.
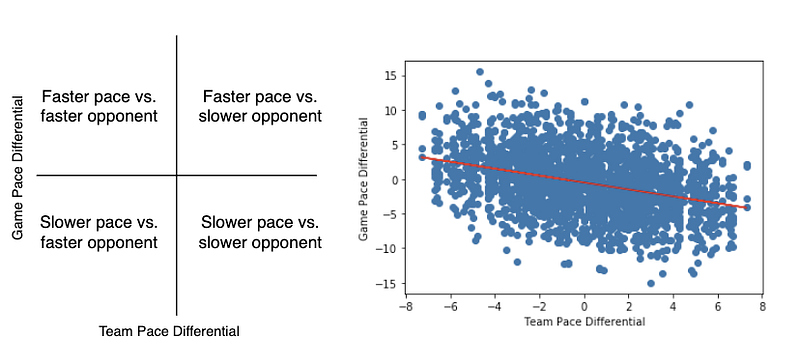
The matrix on the left explains the relationship between GPD and TPD and where a point should lie based on the outcome of the game. A positive trend in the data would represent that the opponent’s pace has no affect on the team they are playing, as it shows that a team can still exceed their season average, whether faster or slower, against an opponent on the opposite side of the pace spectrum. A negative trend in the data represents an opponent’s pace will affect the team they are playing, if the opponent has a faster pace, the team they are playing will play at a faster tempo, and vice versa.
A downward trend can be seen in the scatter plot and the line of best fit further illustrates this. GPD and TPD have a correlation score of -0.34 which associates the relationship with a slightly negative trend. Following the logic from the matrix on the left this supports the fact that a team’s opponent will affect their pace during the game. Instead of an opponent having to keep up with a team or being forced to play their style, team’s are more likely to adapt to their opponent’s playing style when going up against them. I was curious to see how this related to the groups of teams I created and aimed to answer if faster teams had a stronger impact on opponent’s pace than slower teams.
The table below shows the average Game Pace Difference for each group against each group.
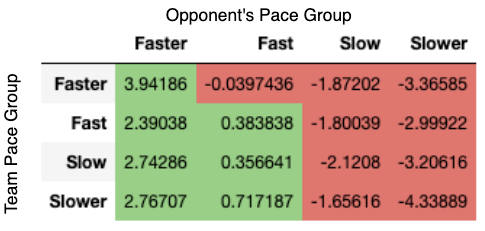
The averages are consistent with the findings from the scatter plot. Faster opponents increase the pace of the team they are playing and Slower teams decrease the pace. Slow and Slower teams have a larger difference in game pace than Fast and Faster teams, showing that slower teams have a stronger impact. I found this interesting because I originally thought Faster teams would have a stronger impact due to the large gap in pace between Faster teams and the rest of the league. However, this makes sense because of the natural flow of the game; a slower team is more likely to hold on to the ball and maintain a full possession versus a faster team that is more likely to shoot quicker, leading to a change in possession. In addition to decreasing the opportunities to change possession by playing a slowed down and methodical offense, the time of possession for the faster team also decreases. Therefore the faster team is prohibited from taking more shots on offense and possibly turning the ball over. I also found it interesting that Faster teams played slightly slower than average against Fast teams. It shows just how much faster they played than other teams, all other groups caused them to play below their season average as faster teams tried to match the pace of their opponent.
There are many reasons as to why a team’s pace varies from game to game and I believe this analysis is a great starting place to further examine how team’s not only change their tempo, but other aspects of their playing style as well. I always figured that a team would plan to completely overpower their opponent in every aspect of the game in their efforts to win but, the fact that a team’s pace is affected by their opponent’s implies that teams prepare to handle their opponent’s strength, instead of trying to exploit every weakness. By following along with this idea and utilizing this method of analysis, new paths to victory can be found that will change the way teams plan to conquer their opponents.
I’m shocked the rockets are a slow team?
It is surprising, but it makes sense when you look at their style of play. Harden is the primary scorer and the Rockets always wanted the ball in his hands. The Rockets were willing to extend the possession to try and get a scoring opportunity for the best player. The fact that Harden is huge iso player can contribute to their slow pace as well. However it did seem to work out for them! The Rockets ranked 2nd in offensive efficiency last year, which goes to show it’s important to make the most of your possessions.
You’re more helpful than you realize.
Like!! Great article post.Really thank you! Really Cool.